Environmental Data Infographic Challenge
Your data tells a story. Can you make someone care in 90 seconds?
← Back to studiesstarter
Venture In
Wero
Observe
Kite
Infer
Whakaaro
Create
Auaha
Evaluate
Tohu
Evidence you will build
- Draft infographic (v1)
- Revised infographic with bias/uncertainty annotations (v2)
- Peer accessibility check record
Why this matters
Infographics can inform or mislead communities — ethical visual choices are part of responsible science communication.
What you will investigate and collect
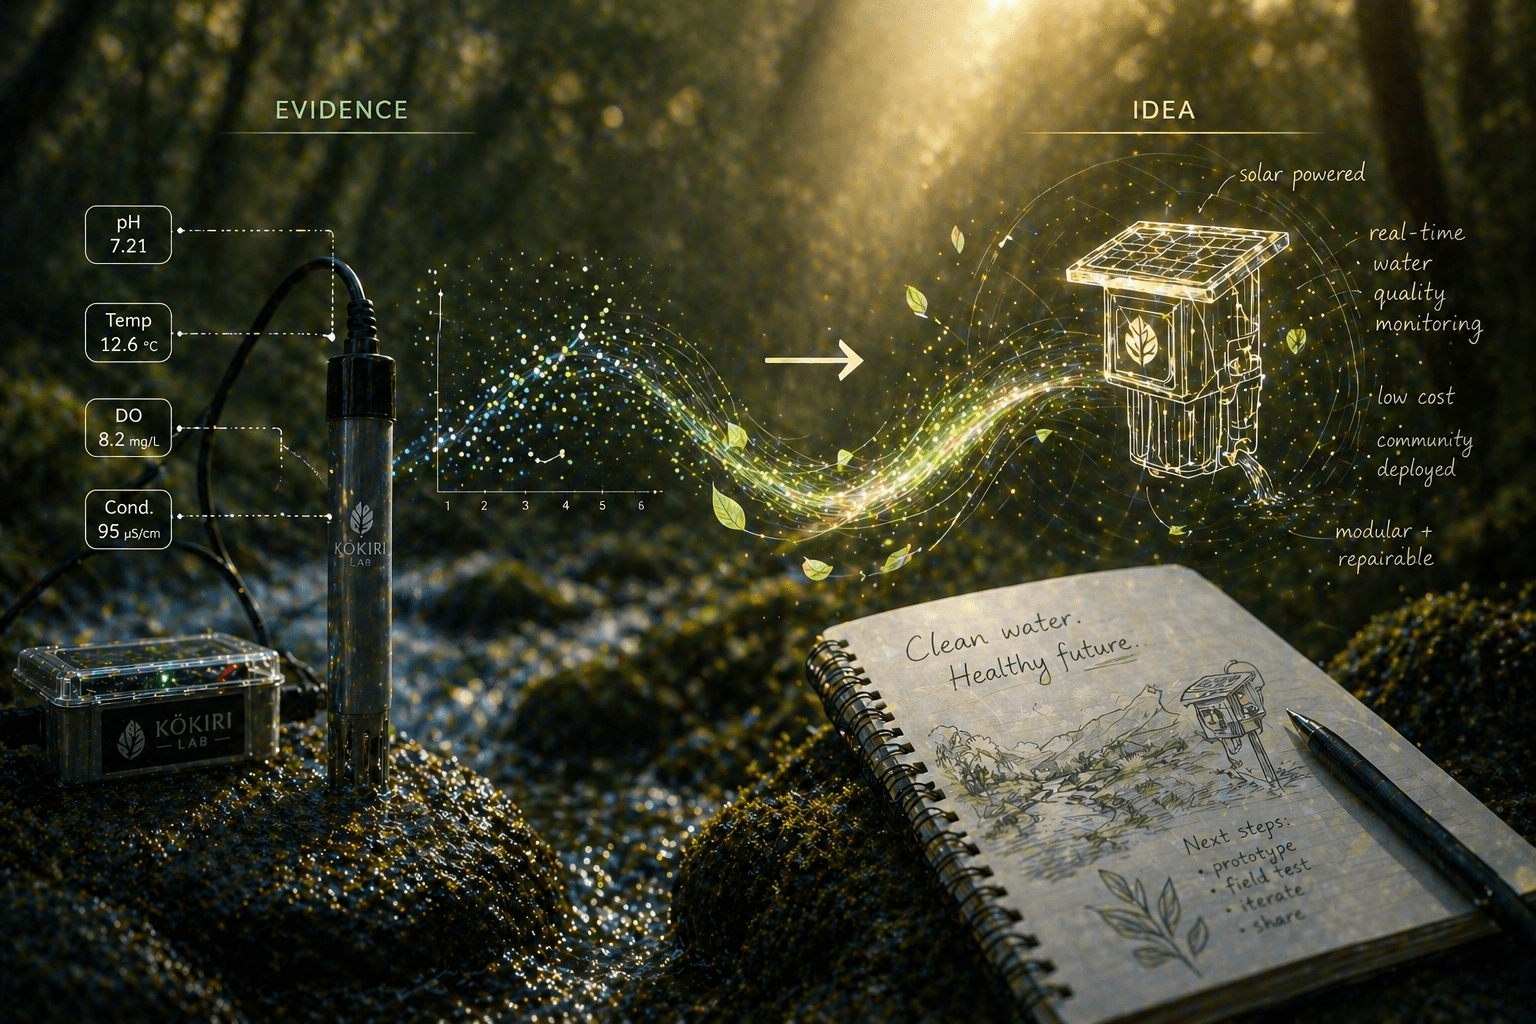
You will turn one of your inquiry datasets into an infographic that an audience outside your classroom can understand at a glance. Which design choices help — and which mislead — when communicating evidence visually. Draft layouts, audience feedback, and a final infographic with explicit uncertainty.
- Date and time
- Draft
- Audience feedback
What you might make or share
- Data visualisationData product
Share your key finding with the community
Summarise the clearest evidence trail from your inquiry for peers.
- Community posterData product
Present your methodology and findings for display
Shows how evidence supports your headline claim and scope.
What you will investigate
You will turn one of your inquiry datasets into an infographic that an audience outside your classroom can understand at a glance.
What you will collect
Date and time, Draft
What you might make or share
A printed A3 or vinyl infographic for whānau or community.