Greenhouse Microclimate Monitoring
Inside the greenhouse, the day swings hot to cool faster than outside. What does that mean for the plants?
← Back to studiesdeveloping
Venture In
Wero
Observe
Kite
Infer
Whakaaro
Create
Auaha
Evaluate
Tohu
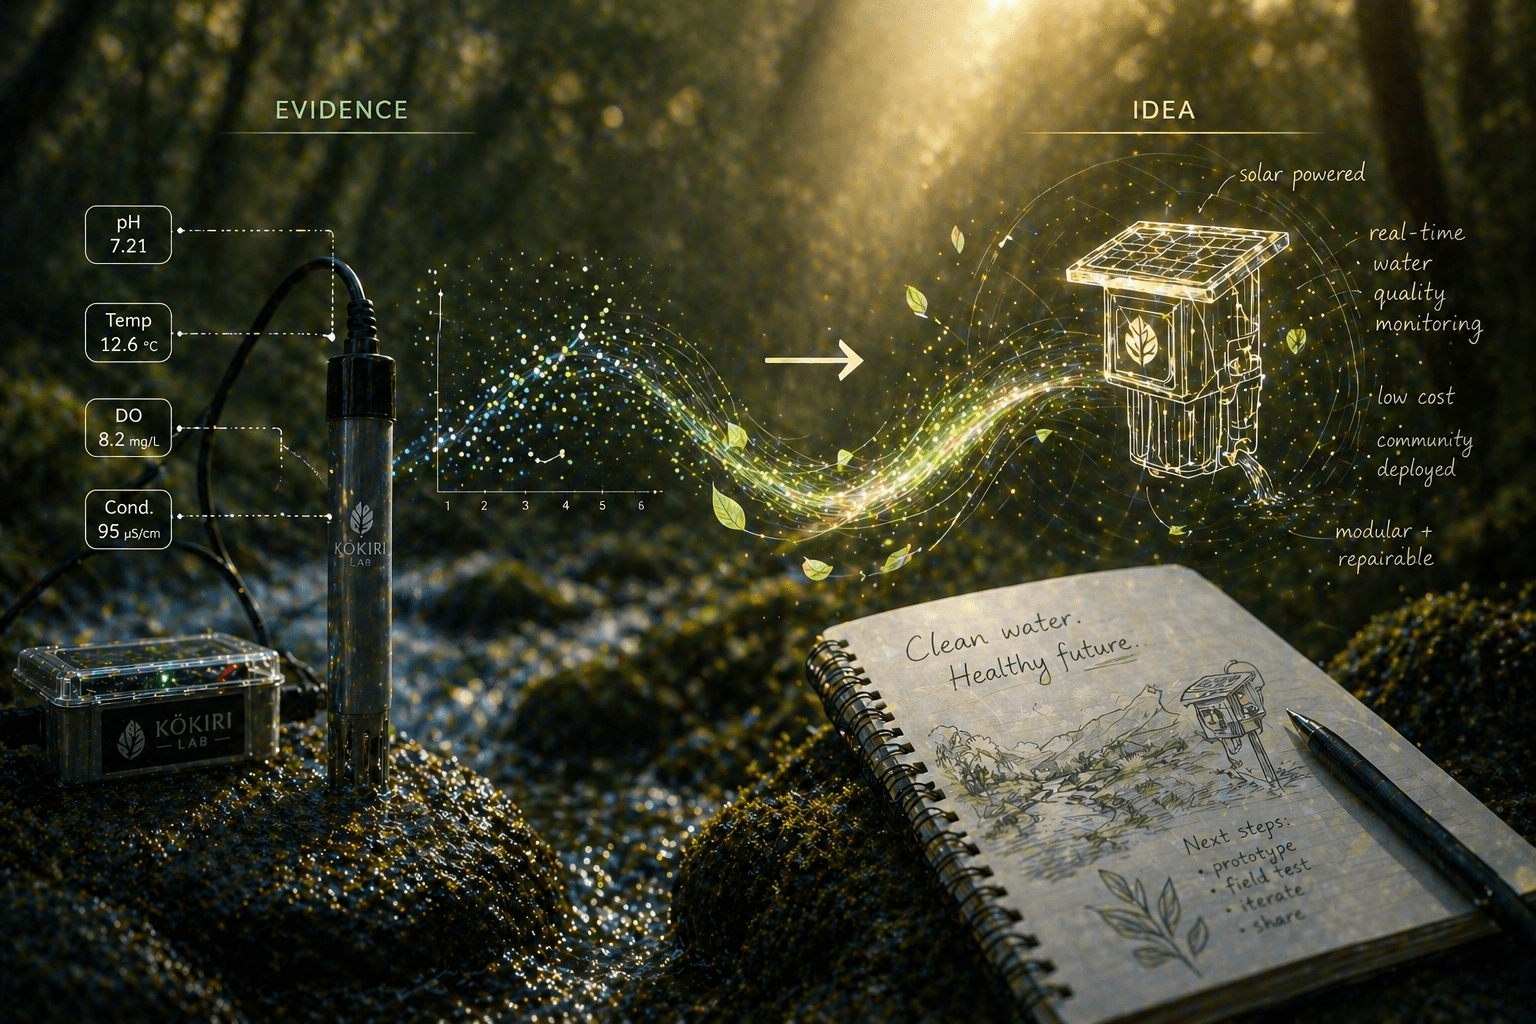
Evidence you will build
- Microclimate time-series dataset
- Annotated trend graph
- System explanation
- Redesign or adjustment note
Why this matters
Microclimate data helps growers and schools tune living systems where small temperature or humidity shifts change outcomes.
What you will investigate and collect
You will track temperature, humidity, and light inside and outside a greenhouse to find the patterns plants experience. How temperature, humidity, and light differ between the greenhouse and outside, and how those differences change across a day or a week. Paired readings of temperature, humidity, and light at set times each day.
- Date and time
- Location (inside / outside)
- Temperature (°C)
- Humidity (%)
What you might make or share
- Sensor mount3D print
Hold a probe at a fixed depth or position match your strongest evidence spots
If readings shift with probe position, fixing the geometry makes patterns interpretable.
What you will investigate
You will track temperature, humidity, and light inside and outside a greenhouse to find the patterns plants experience.
What you will collect
Date and time, Location (inside / outside)
What you might make or share
A printed sensor mount, a temperature alert circuit