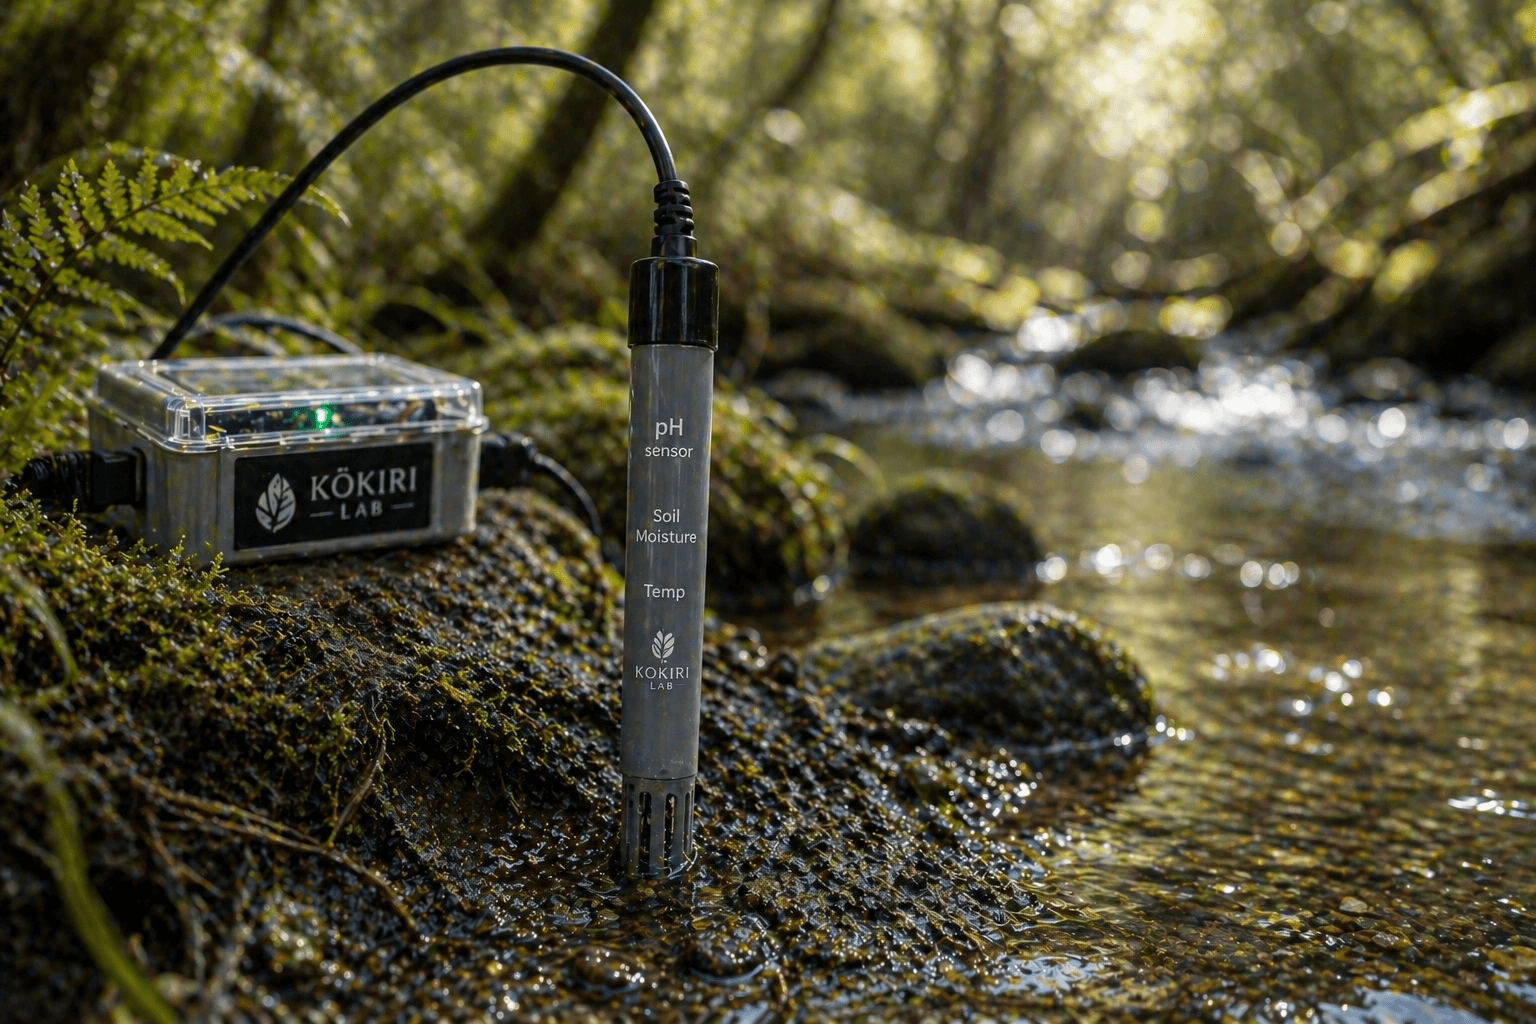
Stream Health Sensor Investigation
Awa near our kura tell a story. Sensors can help us hear what they are saying.
← Back to studiesdeveloping
Venture In
Wero
Observe
Kite
Infer
Whakaaro
Create
Auaha
Evaluate
Tohu
Evidence you will build
- Multi-site measurement dataset
- Site map with annotated data
- Community waterway health report
- Comparison graph (upstream vs downstream)
Why this matters
Awa health data supports iwi and community groups caring for waterways — measurements must be respectful and repeatable.
What you will investigate and collect
You will measure simple indicators of stream health at one or more sites and compare them over time. What sensor readings suggest about the health of your local awa and how readings change across sites and times. Temperature, conductivity, pH, turbidity (visual scale), and a flow note for each visit.
- Date and time
- Site
- Water temperature (°C)
- pH (pH)
What you might make or share
- Sensor mount3D print
Hold a probe at a fixed depth or position match your strongest evidence spots
If readings shift with probe position, fixing the geometry makes patterns interpretable.
What you will investigate
You will measure simple indicators of stream health at one or more sites and compare them over time.
What you will collect
Date and time, Site
What you might make or share
A sensor mount for repeatable readings, a one-page community brief