Guided investigations
Choose a question worth investigating.
Featured
Physical Science
Elastic Band Car Challenge
An elastic band, a chassis, and a question: what makes this car go further? You will find out.
Fair-test motion data builds shared community insights about friction, alignment, and elastic energy — the foundation for redesign.
You will design a simple elastic-band-powered car and test how one change at a time affects how far it travels.
Elastic Band Car Redesign Using Community Insights
Other groups noticed something you missed. Can their insight help you build a better car?
Community insights turn individual car trials into collective design knowledge — when students apply others' evidence carefully.
You will read approved community insights from the Elastic Band Car theme and use them to design and test a second-version car.
SkyLab Flight Investigation
A seed, a paper glider, and a bird — all flyers. What makes one stay in the air longer than another?
Flight investigations connect fluid forces to design choices — insights peers share about drag, lift, and biomimicry.
You will design and test flying objects (paper gliders, falling seeds, or simple winged models) and figure out what affects flight time and distance.
Atomic Theory, Bonding, and the Bohr Model
You cannot see atoms — but models let you predict how elements bond and what formulas mean.
Molecular-level models underpin biotechnology and materials science — from medicines to new materials developed in Aotearoa.
You will represent atoms, ions, and simple molecules using the Bohr model and valence rules, then connect model history to how science builds knowledge.
Acids, Bases, and pH Investigation
Acids and bases are everywhere — from kai preparation to stream health. pH is how we measure them.
pH affects food safety, fermentation, and water health — knowledge communities use when monitoring awa and when processing kai.
You will measure pH, run controlled reactions, identify gases safely, and explain how acid-base chemistry matters in food or environmental contexts.
Carbon Cycle and Climate Investigation
Carbon moves through forests, oceans, soil, and air. Human activity shifts those flows — and the data tells part of the story.
Carbon flows connect whenua, moana, and atmosphere — communities need clear evidence when evaluating climate actions and kaitiakitanga.
You will model carbon across spheres, interpret real datasets, evaluate mitigation strategies, and communicate findings without overclaiming.
Expanding Universe and Space Scales Investigation
Distances in space are so large that light itself becomes a measuring tape — and the universe is still unfolding.
Cosmology invites humility and evidence — including honouring Beatrice Tinsley's Aotearoa contribution to how we understand galaxies and change.
You will calculate cosmic scales, weigh Big Bang evidence, and communicate vastness without misleading your audience.
Environmental Systems
Aquaponics Plant Growth and Nutrient Cycles
Two beds were planted on the same day. One is thriving. One is struggling. What does the water say about why?
Plant growth in aquaponics connects transport biology to sustainable kai systems communities are building across Aotearoa.
You will track plant growth in an aquaponics bed and connect it to the nutrient story the water is telling.
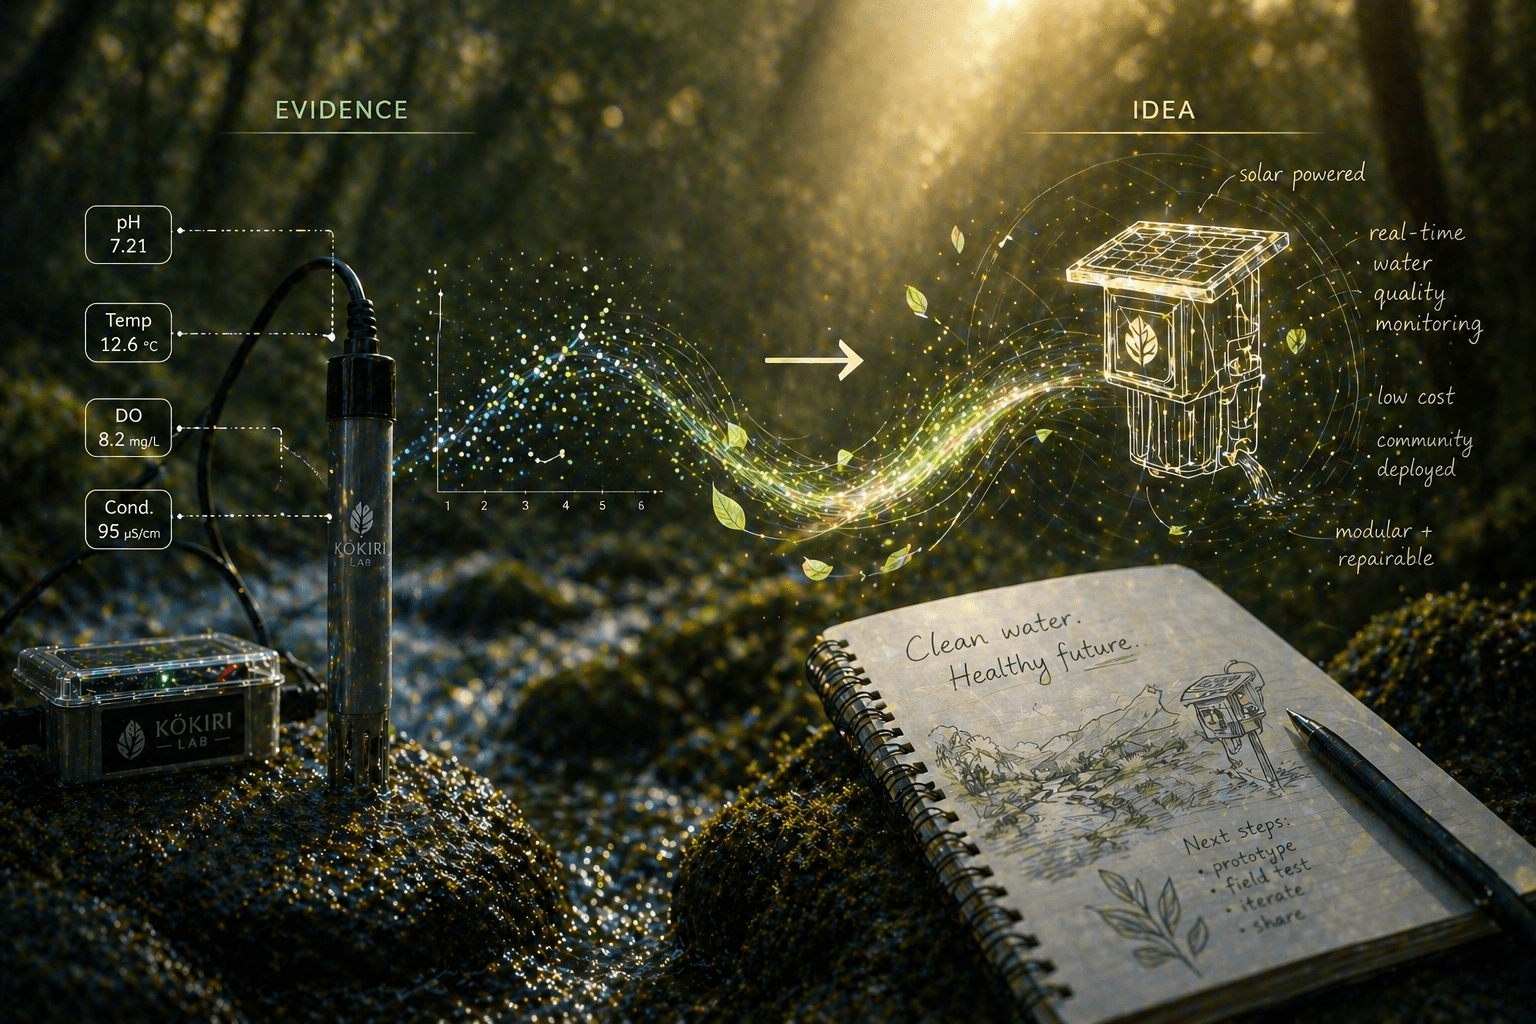
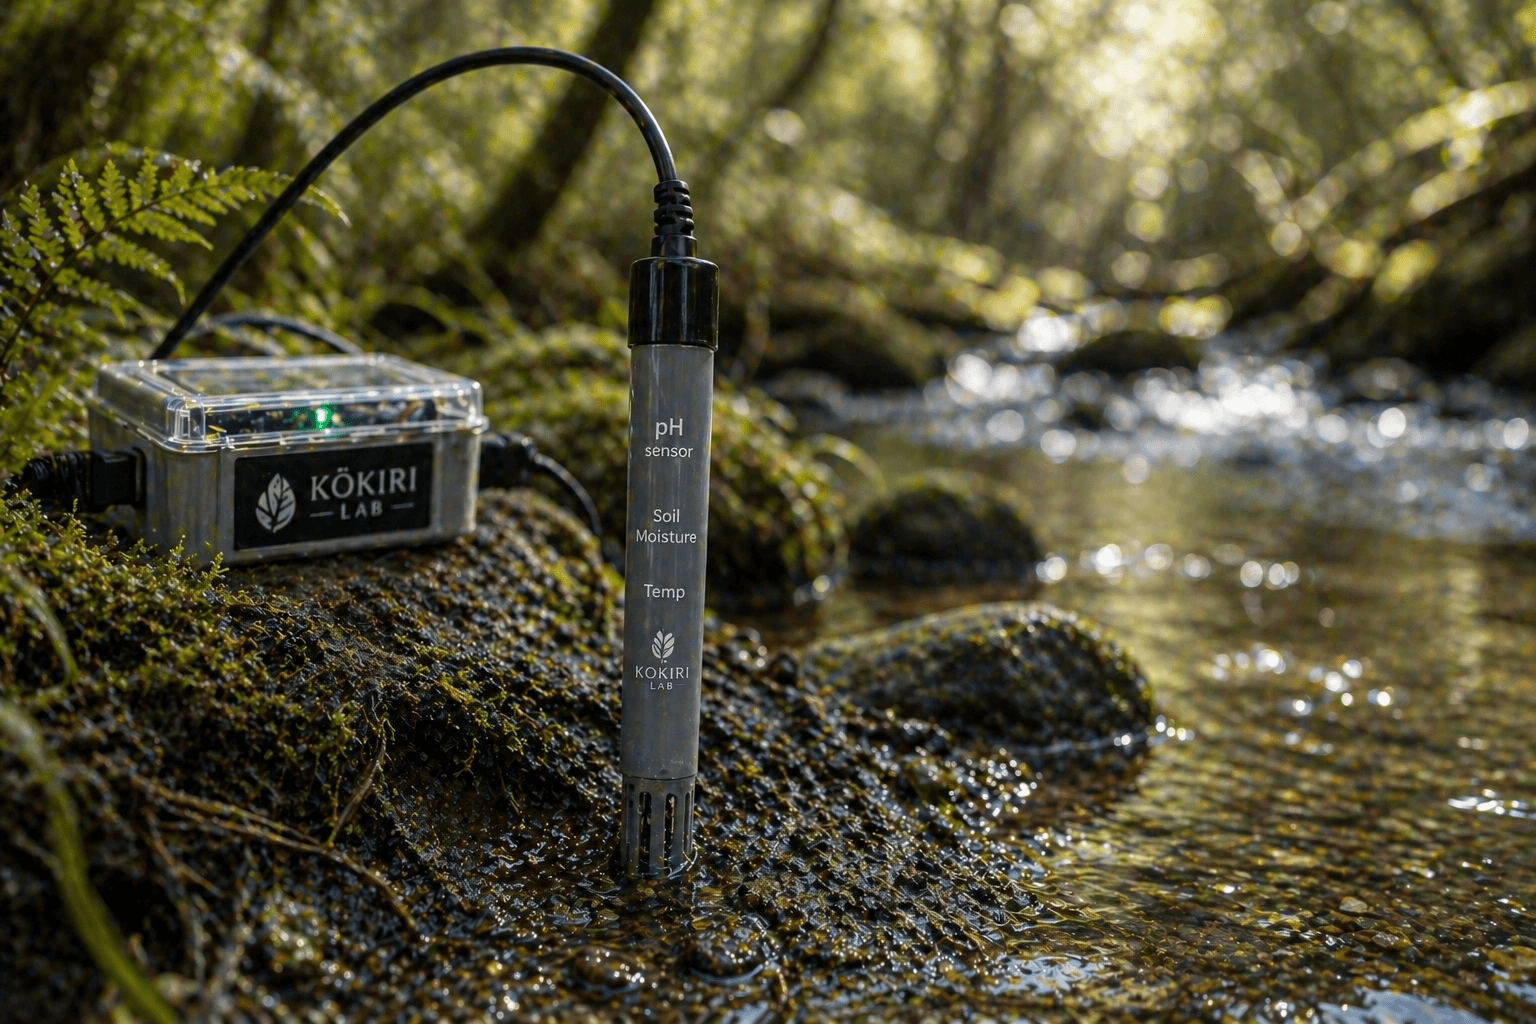
Stream Health Sensor Investigation
Awa near our kura tell a story. Sensors can help us hear what they are saying.
Awa health data supports iwi and community groups caring for waterways — measurements must be respectful and repeatable.
You will measure simple indicators of stream health at one or more sites and compare them over time.
Greenhouse Microclimate Monitoring
Inside the greenhouse, the day swings hot to cool faster than outside. What does that mean for the plants?
Microclimate data helps growers and schools tune living systems where small temperature or humidity shifts change outcomes.
You will track temperature, humidity, and light inside and outside a greenhouse to find the patterns plants experience.
Earth's Spheres and Matter Cycles
Earth is not one system — it is four spheres exchanging matter and energy, and humans are part of the exchange.
Sphere interactions and matter cycles underpin kaitiakitanga — communities need models that connect whenua, moana, air, and living systems.
You will model sphere interactions, trace matter cycles, and analyse human impacts with systems evidence.
Biology and Biodiversity
Light Trap Biodiversity Monitoring
After dark the kura grounds change. A small ultraviolet light could show you who is moving through your site.
Local biodiversity datasets help communities track ecological health and critique AI tools used for species identification.
You will run a MaramaTrap light trap at school over several nights and document the insects that visit.
Insect Hotel Design and Biodiversity
Some corners of the school grounds are full of life. Others feel empty. Could a small structure change that?
Habitat design for pollinators and native invertebrates supports kaitiakitanga and measurable biodiversity recovery.
You will design and place an insect hotel in your school grounds and observe what visits over several weeks.
Wasp Trap Design and Testing
Wasps are a real pressure on local ngahere. Can a careful trap design catch wasps while protecting native insects?
Invasive species management needs evidence-based traps that protect native species — work conservation groups do with schools.
You will compare designs and bait choices to find a trap that targets wasps without harming non-target insects.
Tiny Earth — soil microbes
Invisible life in soil can surprise you — your teacher will guide the setup so you can focus on the evidence.
Soil microbiomes underpin food security and rongoā contexts — honest uncertainty matters when evidence is incomplete.
You’ll compare observation records across samples and look for patterns you can explain carefully.
Pest or Predator Monitoring Design Challenge
Native birds and lizards have predators who hunt at night. A simple monitoring station could show us who is passing through.
Non-harm monitoring data helps pest-free groups and kaitiaki make decisions about where restoration effort is needed most.
You will design a monitoring system (tracking tunnels, chew cards, or camera traps) and use it to map predator presence around your school.
Genes, Traits, and Variation Investigation
Why do you look like you do — and how much of that is written in DNA versus shaped by the world around you?
Understanding variation helps communities protect biodiversity and make sense of health conditions shaped by genes and environment.
You will model how genes and environment shape traits, using class data and a local species case study.
Transport Systems in Plants and Humans
Every cell needs supplies — but how do materials reach cells deep inside a plant or your body?
Transport systems explain how aquaponics, health, and ecosystems move water, nutrients, and oxygen — knowledge used in food and restoration work.
You will compare plant and human transport, run a heart-rate investigation, and link results to systems thinking.
Nervous System and Reflex Investigation
A tap on the knee, a blink in bright light — your nervous system responds before you finish thinking.
Nervous systems and sensors share design logic — understanding reflexes helps students critique both biology and technology.
You will diagram reflex arcs, measure reaction time, and compare biological and technological sensors.
Robotics and Sensing
NuiBot Science Assistant Build
NuiBot is a science assistant — not a toy. What will you ask it to help you investigate?
Microcontroller assistants extend what classrooms can measure — if sensors are calibrated and placed for the question, not the gimmick.
You will assemble (or commission) a NuiBot, calibrate its sensors, and use it as your evidence-gathering partner in a class investigation.
NuiBot Sensor Deployment Challenge
Where you put NuiBot's sensors changes the story it tells. Where will you place it?
Longitudinal sensor deployments generate community-valuable datasets when sampling plans are documented and cross-checked.
You will design and run a real deployment of NuiBot's sensors to answer a question that needs longitudinal evidence.
Arduino Data Logger Investigation
An Arduino can listen for hours longer than you can. What would you ask it to listen for?
Open-source loggers let communities build affordable monitoring — code quality and file handling determine whether data survives the field.
You will build a small Arduino-based logger to capture a single variable on a tight schedule and use the data to answer a real question.
Algorithm and Programming Challenge
An algorithm is a recipe a computer follows — if the recipe is wrong, every graph built from it is wrong too.
Science depends on trustworthy code — students who can design, test, and debug algorithms strengthen every sensor inquiry on the platform.
You will design, code, test, and visualise science data — documenting each step so others can trust your process.
Maker and Design
3D Printed Sensor Mount Design
Your sensor doesn't sit where it needs to. A small printed part could fix that.
Reliable sensor placement turns messy field data into evidence communities can act on — mounts are small but decisive.
You will design and print a sensor mount that solves a real problem from your earlier investigation.
Laser-Cut Scientific Totem or Field Marker
A small marker, well placed, helps the next person find the same spot — or pause where care is needed.
Field markers and totems translate inquiry findings for outdoor audiences — design must be accurate, readable, and respectful.
You will design and cut a wooden totem or field marker that supports an inquiry site or shares a story about it.
Science Club T-shirt or Vinyl Design
What does science look like when you can wear it?
Wearable designs carry identity — honest science club graphics avoid claims the evidence does not support.
You will design a wearable vinyl or t-shirt graphic that says something honest about what your science club stands for.
Data and Communication
Environmental Data Infographic Challenge
Your data tells a story. Can you make someone care in 90 seconds?
Infographics can inform or mislead communities — ethical visual choices are part of responsible science communication.
You will turn one of your inquiry datasets into an infographic that an audience outside your classroom can understand at a glance.
Community Science Poster and Methodology Display
You did real science. Time to show it like a scientist would — with your method as well as your findings.
Community science posters make methods visible — transparency builds trust with iwi, councils, and local groups.
You will produce a scientific poster that shows your question, method, evidence, claim, and the limits of what you found.
Digital Interface Design and Accessibility
A brilliant dataset fails if nobody can read the screen — design choices include or exclude people.
Science platforms only serve communities when interfaces are readable, accessible, and honest about data limits.
You will audit, prototype, test, and revise a simple interface — arguing for accessibility with evidence.